
Factors affecting population distribution at the global scale
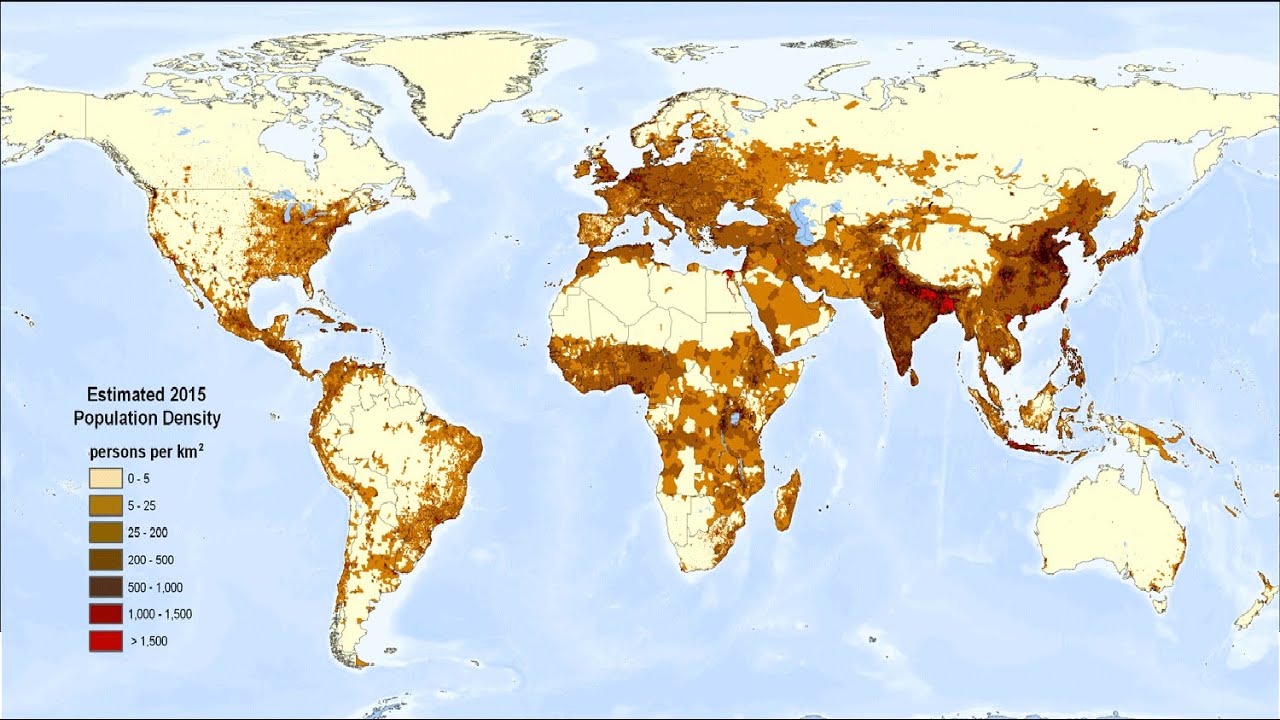
- Proximity to coast: 75% of the population live within 1000 km of the sea.
- Lower altitudes: 85% live in areas less the 500 m high.
- Mostly temperate climate: 85% live between 68°N and 20°N.
- Northern hemisphere: less than 10% live in the southern hemisphere.
The most favorable locations include:
- Fertile valleys
- Regular supply of water
- A climate that is not too extreme
- Places with good communications
Source: NAGLE, GARRETT. IB GEOGRAPHY COURSE BOOK. 2nd edition: OXFORD UNIV Press, 2017. Print.
 Check the link!
Infographic - Factors affecting population distribution at a global scale by Carolina Trevino
Check the link!Infographic - Factors affecting population distribution at a global scale by Carolina Trevino
Global patterns and classifications of economic development - GNI classification
Gross national income (GNI) is defined as gross domestic product, plus net receipts from abroad of wages and salaries and of property income, plus net taxes and subsidies receivable from abroad. Net national income (NNI) is equal to GNI net of depreciation. Wages and salaries from abroad are those that are earned by residents who essentially live and consume inside the economic territory but work abroad (this happens in border areas on a regular basis) or for people who live and work abroad for only short periods (seasonal workers) and whose centre of economic interest remains in their home country. Guest-workers and other migrant workers who live abroad for twelve months or more are considered to be resident in the country where they are working. Such workers may send part of their earnings to relatives at home, but these remittances are treated as transfers between resident and non-resident households and are recorded in national disposable income but not in national income. Property income from/to abroad includes interest, dividends and all or part of the retained earnings of foreign enterprises owned fully or in part by residents (and vice versa). This indicator is measured in USD per capita and in million USD at current prices and PPPs. Data are under 2008 System of National Accounts (SNA 2008) for all countries except Chile, Japan and Turkey (SNA 1993).

Global patterns and classifications of economic development - World Bank income levels
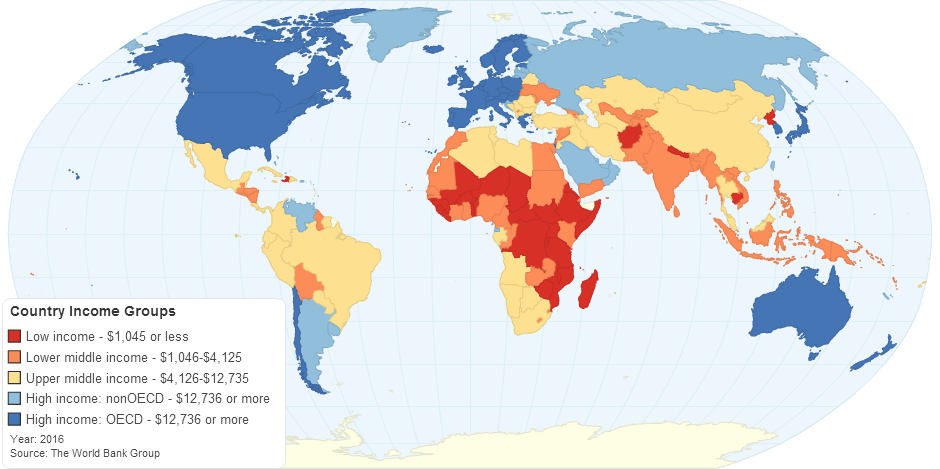
Low-income economies are defined as those with a GNI per capita, calculated using the World Bank Atlas method, of $1,025 or less in 2015; lower middle-income economies are those with a GNI per capita between $1,026 and $4,035; upper middle-income economies are those with a GNI per capita between $4,036 and $12,475; high-income economies are those with a GNI per capita of $12,476 or more.
Other economic classifications
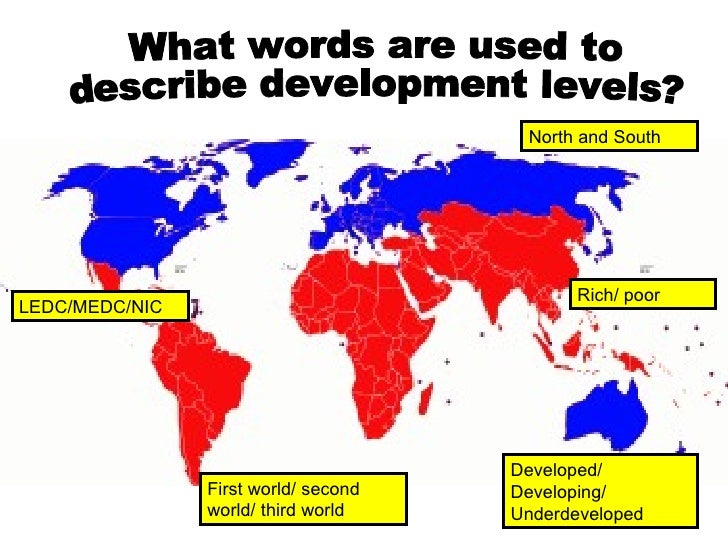
MEDCs vs. LEDCS

NICs

BRICS
Brazil, Russia, India, China and South Africa (BRICS) is an acronym for the combined economies of Brazil, Russia, India, China and South Africa. BRIC, without South Africa, was originally coined in 2003 by Goldman Sachs, which speculates that by 2050 these four economies will be the most dominant. South Africa was added to the list on April 13, 2011 creating "BRICS".
As of 2011, these five countries were among the fastest growing emerging markets. It's important to note that the Goldman Sachs thesis isn't that these countries are a political alliance (like the European Union) or a formal trading association - but they have the potential to form a powerful economic bloc. BRIC is now also used as a more generic marketing term to refer to the four original emerging economies.
MINTs
The former Goldman Sachs economist Jim O'Neill will forever be associated with the term BRIC, which he coined as an acronym for Brazil, Russia, India and China (now commonly bracketed with South Africa to make BRICS). The term caught on and has been common parlance for a decade now. And now O'Neill, though no longer with Goldman, has a new one: the MINT countries.
Mint? This term refers to Mexico, Indonesia, Nigeria and Turkey, and O'Neill's premise is that these will be the next economic powerhouses. They are bound by a few key themes: young populations, useful geographical placement, and (Turkey excepted) by being commodity producers.
CIVETS
An acronym given to the countries Colombia, Indonesia, Vietnam, Egypt, Turkey and South Africa, which are predicted by some to be among the next emerging markets to quickly rise in economic prominence over the coming decades. The acronym plays off the term BRIC (Brazil, Russia, India, and China) which indicates the fastest growing emerging economies over the last decade.
The positive aspects of the CIVETS group of countries includes relative political stability (especially when compared to previous generations), young populations that focused on education and overall growing economic trends. Exposure to these countries has recently become possible for the retail investor through the use of ETFs from specific countries.
N11
'Next Eleven'. Also known as N-11, these are the eleven countries that, according to a Goldman Sachs Group, Inc. (GS) prognosis, have the potential to become the world's largest economies in the 21st century. These are: Bangladesh, Egypt, Indonesia, Iran, Mexico, Nigeria, Pakistan, the Philippines, Turkey, South Korea and Vietnam. Goldman Sachs made its prediction in 2005, using such criteria as trade openness, economic and political stability, and quality of education.
Centrally planned economies
A centrally planned economy is an economic system in which the state or government makes economic decisions rather than the interaction between consumers and businesses. Unlike a market economy in which private citizens and business owners make production decisions, a centrally planned economy controls what is produced and the distribution and use of resources. State-owned enterprises undertake the production of goods and services.
Most developed nations have mixed economies that combine aspects of central planning with the free market systems promoted by classical and neoclassical economists. Most of these systems skew heavily toward free markets, with government interventions only for certain trade protections and coordination of certain public services.
Examples of Centrally Planned Economies
Communist and socialist systems are the most noteworthy examples in which governments control the factors of economic production. Central planning is often associated with Maxist-Leninist theory and the former Soviet Union, China, Vietnam and Cuba. The economic performance of these states have been mixed, though they generally trailed more capitalist countries in terms of growth. Historically, most centrally planned economies have been administered in authoritarian states, though participation in such an economy could theoretically also be elective.

Oil-rich countries

Population distribution and economic development at the national scale - China

Source: http://countrymeters.info/images/data/cn/China_population_density_by_adm_regions_English.png
The overall trend of China shows a very uneven population distribution. The country can be clearly divided into two distinct halves by the pattern of its population, the east section and the west section. The east is considerably more densely populated than the west and has areas with more than 400 people per km²; these are situated on the central segment of the east coast and slightly further inland aswell. There are some more areas of dense population on the southeast coast of the eastern half, while what remains of the east is mostly 100-400 people per km², with some areas of 10-100 people per km² and even fewer areas of 10 people per km². The west is the opposite extreme, it is very sparsely populated with a huge area where there are only 10 people per square kilometre. Although around the boarder are some slightly more densely populated areas.
The east section of China can then be sub-divided down further into another two areas, which show internal variation. On the central section of the east and lower southeast coast there are the most highly populated areas of China, with a lot of divisions with more the 400 people per km² even more areas of 100-400 people per km². The segments that remain in the north and south west of the eastern section are more sparsely populated with only 10-100 per km².
The western section can also be broken down into two further fragments, which show internal variation. In small sparsely distributed areas all around the boarder of the western section are areas where there are 10-100 people per km² but the rest of the west is all about 10 people per km².
Source: http://www.markedbyteachers.com/as-and-a-level/geography/population-distribution-in-china.html
Internal migration in China
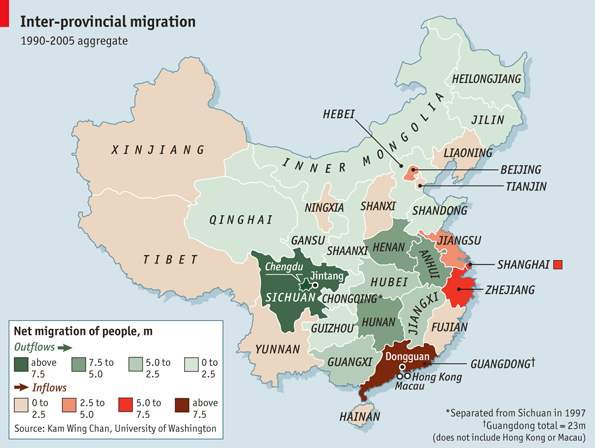
IF YOU purchased one of the 1.8 billion mobile phones shipped around the world last year, there is a 50% chance it was put together in the Chinese province of Guangdong. There is also a good chance it was not assembled by a native Guangdonger, but by one of the millions of migrants who have left their homes and travelled to the coast to find work. Grinding poverty has long been a cause of migration and was the impetus again after the death of Mao Zedong in 1976. The story of migration since then is the story of modern China, as migrant workers have transformed China's economy.
Kam Wing Chan of the University of Washington has compiled statistics which show that from 1990 to 2005—the most recent period for which reliable statistics are available—there was an overall gross migration across provinces of about 80m migrants (see map). An increasing number also migrate within their own province. All told, some 230m Chinese spend most of the year away from their home town or village. This is almost a third of all people globally estimated by the UN to be migrating within the borders of their own country. Most migrants move in search of work. The number of rural Chinese working away from home is now almost 160m, or 12% of the country's population. The Chinese government's population-planning commission forecasts another 100m rural residents could move to cities by 2020. As migration patterns change, though (see article), expect to see rapid social and economic change across inland China.
Population distribution and economic development at the national scale - South Africa

Kwazulu-Natal has the largest share of population in the coastal areas. Approximately 9 million people live in the province and they are Zulu-speakers. The Eastern Cape Province has the second largest population with 5.8 million people and they are Xhosa-speakers. Northern Cape remains the province with the smallest population, with approximately 1.1 million people, who are Tswana and Coloured.


Synthesis and evaluation
Use the content from this post to answer the following exam style question: ‘Discuss the relative importance of different influences on where people live and spatial interactions between places at varying scales’. 10 marks
Use mark scheme on page 56 from the new syllabus guide (AO3).
No comments:
Post a Comment