
HL4.2 Global networks and flows
Global trade in materials and manufactured goods and services
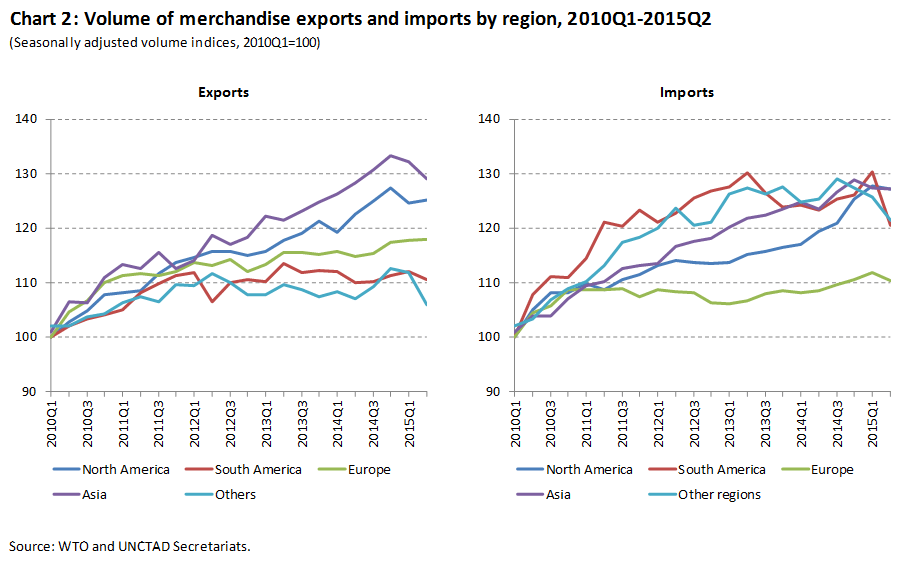
In the context of the global crisis international merchandise trade registered its greatest plunge since the Second World War: Between the fall of 2008 and the spring of 2009 global trade collapsed by 20 per cent in volume. Having initially rebounded sharply beginning in mid 2009, growth in international merchandise trade then slowed again in the course of 2010. While regaining its pre-crisis peak level in that year, the global crisis appears to have left a marked impact on the dynamism of global trade, keeping the volume of global trade well below its pre-crisis growth trajectory (Chart) with global prospects dimming by year-end 2011.
Long-term trends in value and volume of merchandise exports, 1950-2010
(Index numbers, 2000=100)

Source: UNCTAD secretariat calculations, based on UNCTADstat and CPB Netherlands Bureau of Economic Policy Analysis, World trade database
Globalization features the rise in global exports relative to global income, while individual countries see their respective exports and imports rise as shares of national income. In other words, a rising proportion of global production of goods and services is being traded across borders rather than sold at home. The global crisis has brought the long-run trend of rising global integration through trade to a halt, at least temporarily. The pre-crisis trend toward more openness and ever-deeper trade integration might well firmly reestablish itself in due course. But persistence or trend reversal seem also possible. At a time of high unemployment, fiscal austerity, and complaints of currency wars, the threat of rising trade protectionism is looming large.
The global crisis and uneven trade recovery have reinforced the ongoing shift in balance in the world economy, featuring the relative decline of developed countries (Chart). In 2010 the value of total merchandise exports from all countries of the world was $15 trillion (in current United States dollars), of which the share of developed countries was 54 percent, down from 60 percent in 2005. As the world’s leading merchandise exporter since 2009, China’s share of world exports climbed to 10 per cent in 2010, ahead of the United States (8 per cent), Germany (8 per cent), and Japan (5 per cent) (Table). On the import side, the ranking still shows the United States in first place (13 per cent), followed by China (9 per cent), Germany (7 per cent), and Japan (4.5 per cent).
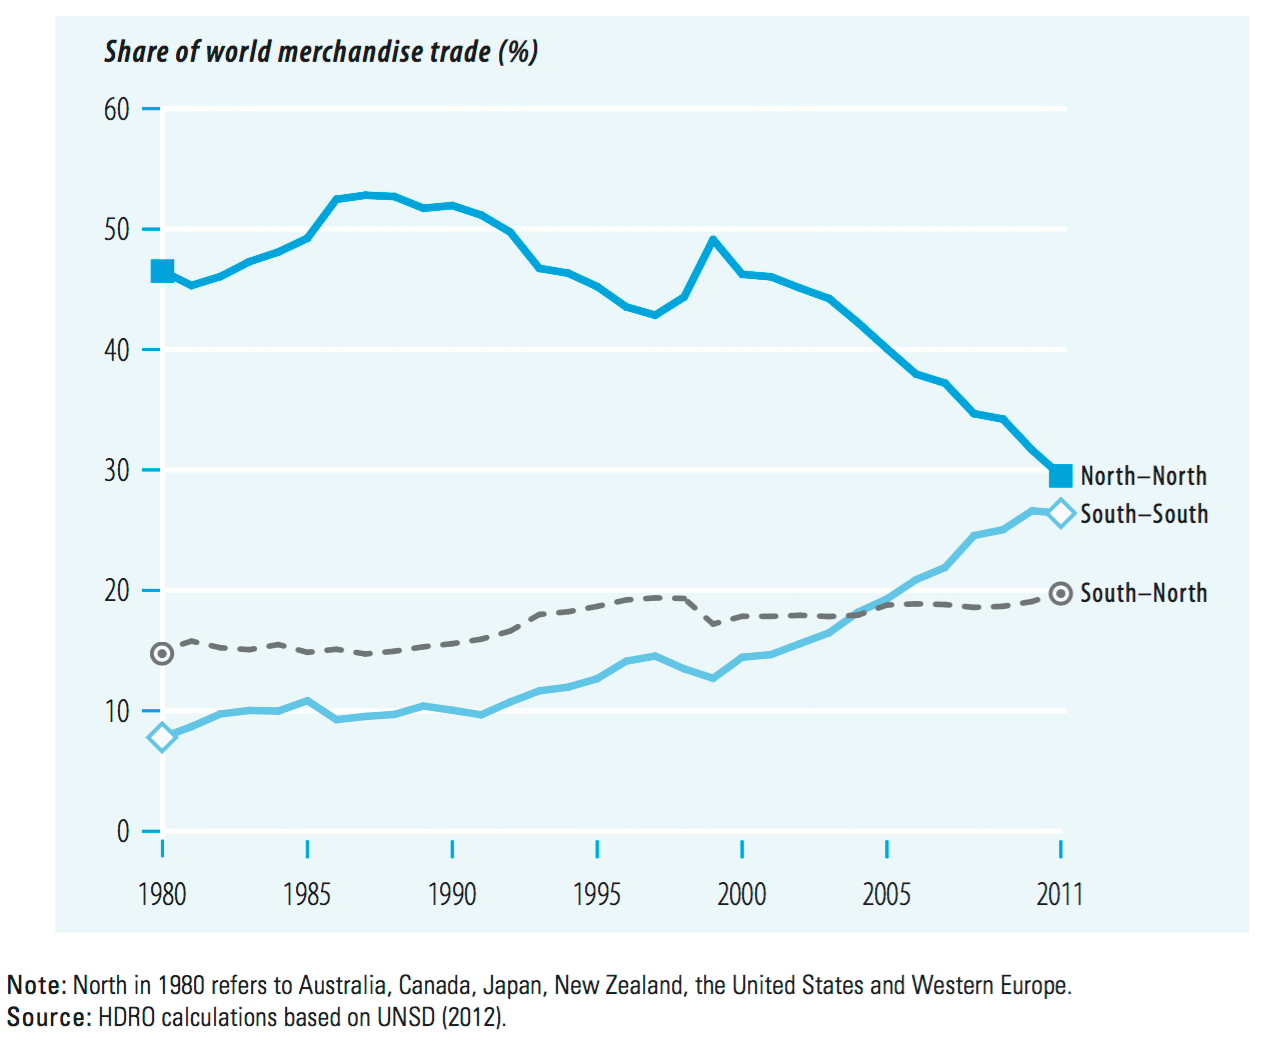
The shifting global balance is also visible in the changing distribution of exports by destination, featuring the rising importance of trade among developing countries. The rise in South-South trade has been especially pronounced in East Asia and is linked to the gain in prominence of global supply chains.
Share of South-South merchandise trade, 1995-2010
(Percentage of total trade in developing economies)

Source: UNCTAD secretariat calculations, based on UNCTADstat
Note: South-South trade is also known as intra-trade of developing economies.
International aid
Emergency aid: Help that is given to a country that is suffering from a natural disaster or conflict. Emergency aid may include food, water, tents, clothing or even rescue teams to look for victims of natural disasters.
Development aid: Aid that is given to benefit the country. This might be money given to build a new road or port to improve infrastructure or money given to build a new hospital or school to benefit the people of a country.
.jpg)

loans and debt relief

Even though Japan has the highest ratio of debt to GDP, the US probably has the world's biggest debt at about 15 trillion dollars. Even though this is a massive amount of money, in terms of debt repayments (debt service), the US is spending a much smaller percentage of its GDP than many smaller poorer countries. The US currently spends around 10% of GDP on debt service, although this is expected to increase to about 15%.
For example during the 1990's Nicaragua in Central America had the largest per capita debt in the world. In the late 1990's Nicaragua had a debt of $6.1 billion, which equated to about $1,300 per capita. The government had to spend half its revenue on service debt (paying interest on debt). So even though Nicaragua's total debt was a fraction of the US's it was financially in a much worse position.

The HIPC Initiative was launched in 1996 by the IMF and World Bank, with the aim of ensuring that no poor country faces a debt burden it cannot manage. Since then, the international financial community, including multilateral organizations and governments have worked together to reduce to sustainable levels the external debt burdens of the most heavily indebted poor countries.
In 1999, a comprehensive review of the Initiative allowed the Fund to provide faster, deeper, and broader debt relief and strengthened the links between debt relief, poverty reduction, and social policies.
In 2005, to help accelerate progress toward the United Nations Millennium Development Goals (MDGs), the HIPC Initiative was supplemented by the Multilateral Debt Relief Initiative (MDRI). The MDRI allows for 100 percent relief on eligible debts by three multilateral institutions—the IMF, the World Bank, and the African Development Fund (AfDF)—for countries completing the HIPC Initiative process. In 2007, the Inter-American Development Bank (IaDB) also decided to provide additional (“beyond HIPC”) debt relief to the five HIPCs in the Western Hemisphere.
Remittances
A remittance is the funds an expatriate sends to their country of origin via wire, mail, or online transfer. These peer to peer transfers of funds across borders are economically significant for many countries that receive them.

Dilip Ratha: The hidden force in global economics: sending money home
Illegal flows
Human trafficking
.png)
Counterfeit goods


Source: https://www.raconteur.net/wp-content/uploads/2015/09/Origin-and-category-of-counterfeit-goods.jpg
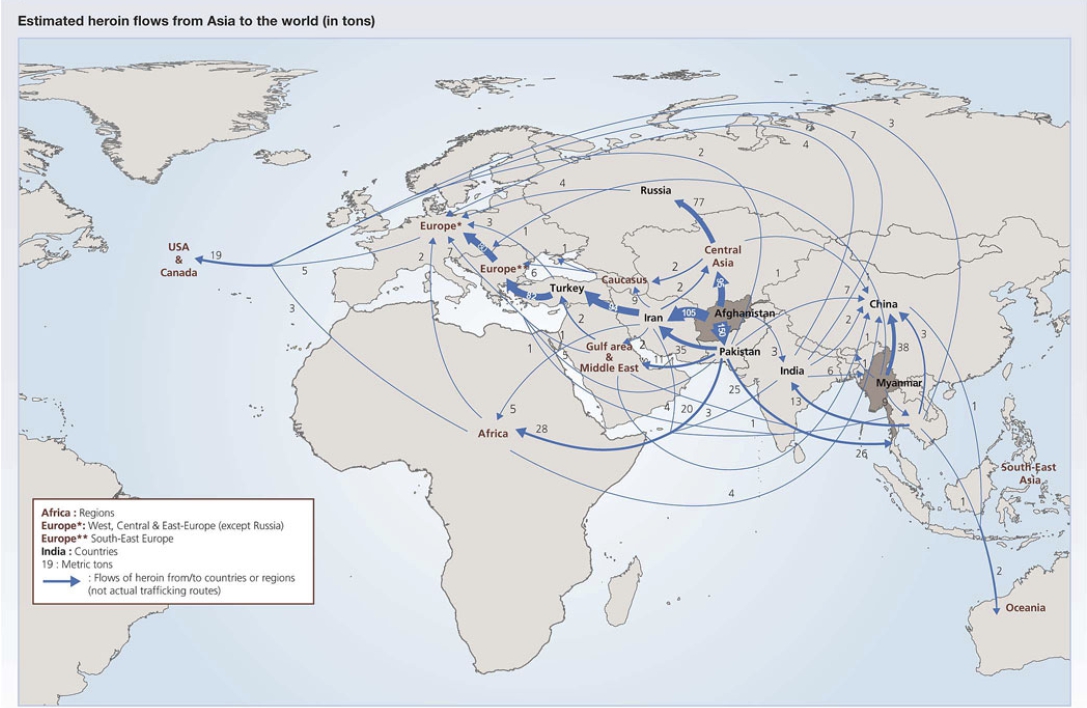
Flow of drugs

Cannabis and Hashish

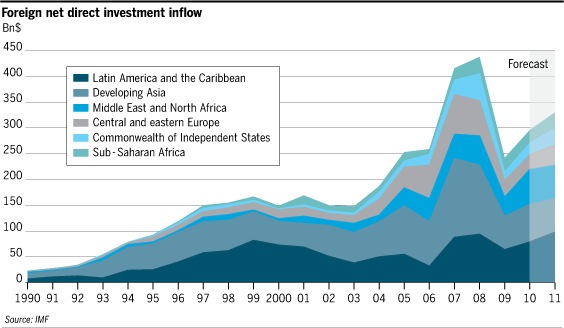
Foreign direct investment
Most countries want to attract FDI because it helps their economy grow and creates jobs. LEDCs can present themselves as attractive locations for FDI because of the potential profits. Enterprises that have been invested in, in LEDCs may present high levels of profit because of:
Cheap labour
New markets
Low taxation
Cheap land and resources
Relaxed planning and environmental regulations
However, despite attractions, it is still MEDCs that receive the most FDI. LEDCs can miss out on FDI because of:
Unstable or corrupt government
Poor transport and communication links
Poverty reducing potential market
Complicated regulations in foreign languages
Unstable currencies or economies
Some growth economies and emerging markets like China, India and Brazil are seeing increases in FDI, but until LEDCs are able to improve their economies and infrastructure they will continue to lose out to MEDCs. It must also be remembered that FDI can cause problems and is not always advantageous. Problems may include increased pollution, inflation, exploitation of resources, economic leakage and closure of local industries.

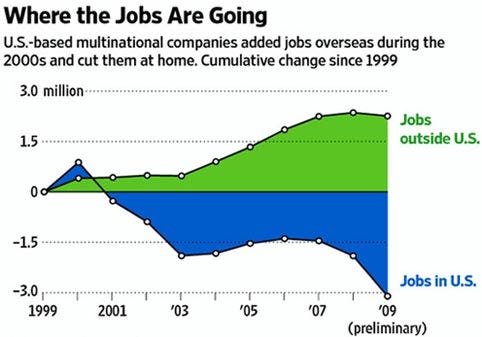
Outsourcing
Outsourcing: The process of taking internal company functions and paying an outside firm to handle them. The process of outsourcing part of your business operations to another company is known as subcontracting.
- The reasons companies outsource can vary, but may include:
- To reduce costs
- To improve quality of service
- To access and benefit from outside expertise
- To avoid training costs
- To focus on core business
- To improve choice
- To reduce risk (less investment, less direct employees)
- Avoid pay health insurance, pension contributions, etc. for workers
In order for cities, regions or countries to become attractive locations for TNCs to outsource, they will have to fulfill numerous requirements including:
- Improving internet speed, capacity and reliability
- Improve language skills of workers especially in English
- Improve IT skills and understanding
- Train workers in culture and customs of potential customers home countries
- Ensure reliable telephone connections
- Offer 24 hour service - important the contracting company is in a different time zone or even hemisphere.
- Offer a high quality service cheaper than potential customers can provide themselves
Synthesis and evaluation
Use the content of this post to answer the following question: ‘Discuss the relative importance of different flows, and the suitability of different methods for geographically representing flows and interactions’. 10 marks.
Use mark scheme on page 56 from the new syllabus guide (AO3)
No comments:
Post a Comment